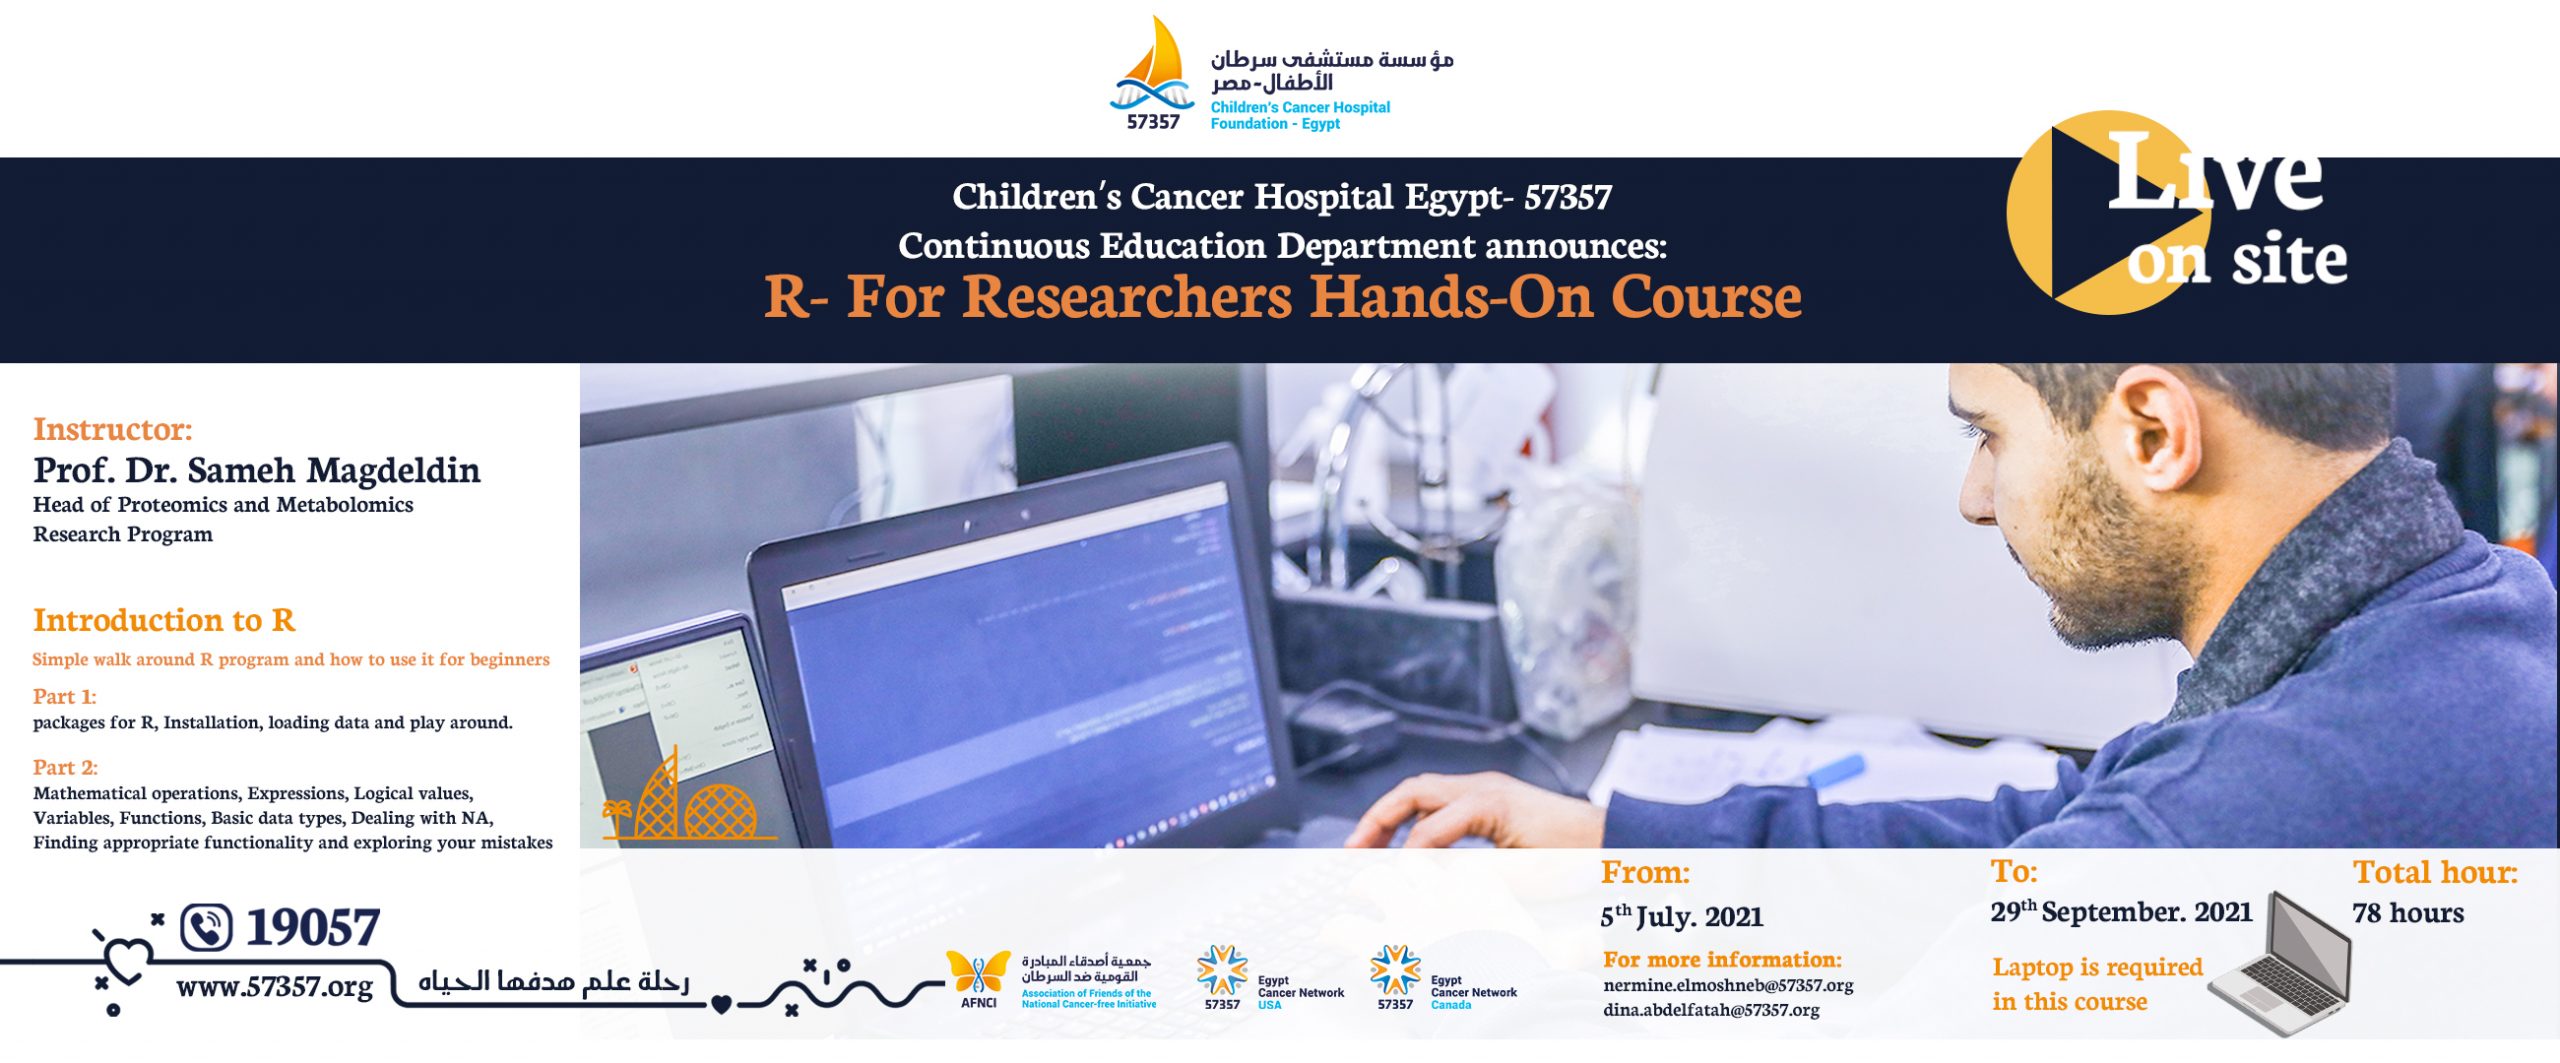
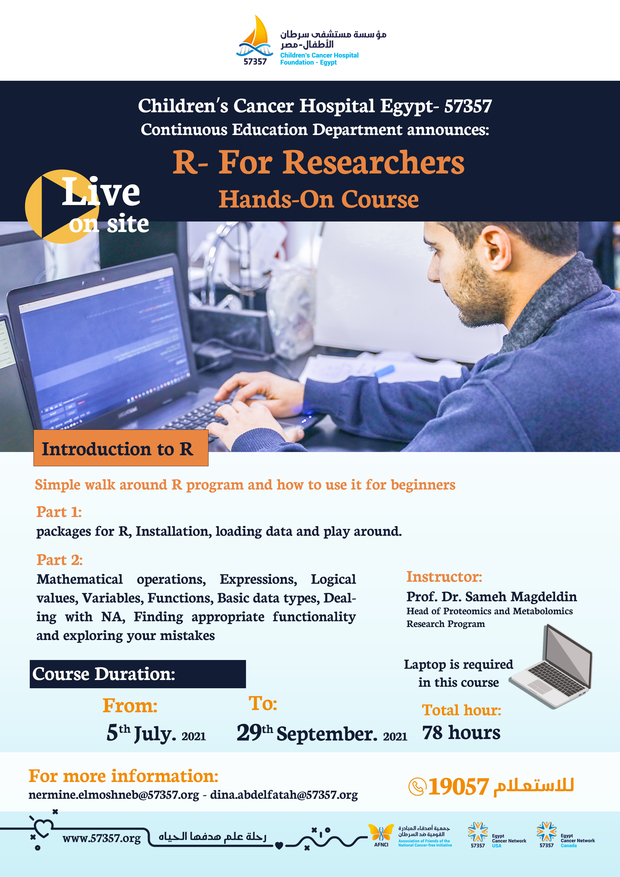
R-for Researchers

Course overview

Assuming unbiased experiment, researcher’s dilemma is circled in their limited capability to perform an appropriate data manipulation, biostatistical interpretation, and professional graphical presentation for their data. The course represents a simple walk around R program, data manipulation with R and how to use it for beginners.
It is essential for all researchers for unbiased research analysis. The course focuses on the yet, most powerful graphics package recommended by top leading journals such as Nature and Cell. It gives you a hint on how to read and draw a logistic regression (S- shaped) curve also making Multivariate analysis test used to predict strong correlation pattern within dataset variables.
The course covers a multitude of topics including Introduction to R; Biostatistics with R; Basic graphics with R; Advanced graphics with R; Correlation and regression with R; Logistic regression with R; Principle component analysis with R; Receiver operating characteristics (ROC) curve with R; Data manipulation with R.
Course Description
- Opening statement:
Assuming unbiased experiment, researcher’s dilemma is circled in their minimal capability to perform an appropriate data manipulation, biostatistical interpretation, and professional graphical presentation for their data. As a result, their quality of research needs much improvement. This corner stone course focus on building researchers skills in these 3 pillars for competitive international publication purpose using a popular open source- code based language called R.
- Short statement:
Building skills on how to deal with your data, analyze it and present it in a professional way.
- Targeted attendee:
Priorities: Demonstrators, assistant lecturers and lecturers
- Proposed courses:
| Course name | Duration | Difficulty level |
| Introduction to R | 2 days | Simple |
| Biostatistics with R | 4 days | Moderate |
| Basic graphics with R | 2 days | Simple |
| Advanced graphics with R | 4 days | Moderate |
| Correlation and regression with R | 2 days | Moderate |
| Logistic regression with R | 1 day | Moderate |
| Principle component analysis (PCA) with R | 1 day | Moderate |
| ROC curve with R | 1 day | Moderate |
| Data manipulation with R | 2 days | Moderate |
Other instructions apply:
1. All courses require laptop availability with prior preparation and installation
2. Priorities for seat reservation in the courses:
- Demo, ass. Lec, and Lec. However, others are welcomed
- Different colleges
- All packages course price (allow you attending all courses once)
- Price: 1000
- Evaluation
- Main aim of these courses is to build your skills rather than evaluation. An open book home works exercises will be applied to evaluate your performance.
- Attendance passed 2 courses with overall grades >95% will be awarded a free course.
- All attendance will be provided with a certification for course completion.
- Registration [payment and pre-installation setting]
Physiology department, Faculty of Veterinary medicine, Suez Canal University. [Mr. Sharaf]
6. Tutor: Sameh Magdeldin M.V.Sc, 2 Ph.D
Ass. Prof. of Physiology
R programing and statistical inference certification, John Hopkins
Detailed course description:
- Introduction to R
- Simple walk around R program and how to use it for beginners. The course is mainly designed to be familiar with the program before using it in a professional way for your research purpose.
- Part 1: What is R, reason to use it, packages for R, Installation, loading data and play around.
- Part 2: Mathematical operations, Expressions, Logical values, Variables, Functions, Basic data types, Dealing with NA, Finding appropriate functionality and exploring your mistakes.
2. Biostatistics with R
- How to refine your data before analyzing it, choose you appropriate test and interpretate the data in a professional manner. This course is essential for all researchers for unbiased research analysis.
- Part 1: Simple Mathematics, Descriptive statistics, Dealing with outliers, Normality tests (Shapiro-Wilks, Kolmogrov-Smirnov, Anderson-Darling).
- Part 2: Frequency and contingency tabulation (Cross tabulation), Test of independence (Chi- Square, Fisher exact test, Cochran Mantel Haenzel test), Measuring the strength of 2 way contingency tables.
- Part 3: T test (dependent and independent), Pair wise T test, Mann-Whitneys U test, Wilcoxon signed rank test, ANOVA, Kruskal- Wallis, Friedman test, Post hoc test example (Tukey’s).
3. Basic graphics with R
- This course enables you to learn how to draw the basic graphics for your research using the base built in graphics package in R.
- Line chart, Bar chart, Histogram, Box and Whiskers, combining graphics, Scatter plot matrix.
- Advanced graphics with R
- A professional course enables you how to draw a professional graphics for international publications. Additionally, it lets you determine the appropriate graphics panel based on your data.
- The course focuses on ggplot 2 package, the yet, most powerful graphics package recommended by top leading journals such as Nature and Cell.
- Part 1: Whiskers and box plot, Whiskers and box plot overlaid with dot plot, Violin plot, Scatter plot.
- Part 2: Introducing the power of faceting, line plot, error bars, Histograms, Histograms overlaid with density curve, density curve.
- Part 3: Heat map analysis, bar plot, stacked bar plot, proportional stacked bar plot, scatter plot matrix.
- Correlation and regression with R
- Understand how to correlate variables and fit a regression model for your data in a professional manner.
- Part 1: Correlation (Pearson, Spearman, Kendall), Simple liner regression, Global validation of liner model assumption,
- Part 2: Multiple liner regression, testing outliers and dropping values, non-liner regression, Quality check of fitted model.
- Logistic regression with R
- Understand how to perform a logistic regression and predict binomial (binary) variable. Additionally the course gives you a hint on how to read and draw a logistic regression (S- shaped) curve.
7. Principle component analysis with R
- A Multivariate analysis test used to predict strong correlation pattern within dataset variables. This course lets you know how to perform, read and draw a PCA.
8. Receiver operating characteristics (ROC) curve with R
- Understand how to perform and read a ROC curve. Choosing a cut point between poor observations and good ones.
9. Data manipulation with R
- This course enables you dealing with large data input in a professional way. Unlike spreadsheet (excel) avoid errors and save time by using automated coding.
Course Objectives
The course is mainly designed to allow researchers to be familiar with the R program, an open source- code based language, before using it in a professional way for your research purpose. The goal of this comprehensive course is to build researchers’ skills in data manipulation, biostatistical interpretation and graphical representation of data. Acquiring such skills is crucial in an era of competitive international publication.
Upon completion of this course, participants will be able to:
- Refine your data before analyzing it, choose you appropriate test and interpret the data in a professional manner.
- Learn how to draw the basic graphics for your research using the base built in graphics package in R.
- Understand how to correlate variables and fit a regression model for your data in a professional manner.
- Deal with large data input in a professional way. Unlike spreadsheet (excel) avoid errors and save time by using automated coding.
- Draw professional graphics for international publications.
- Understand how to perform logistic regression and predict binomial (binary) variable.
- Demonstrate knowledge on how to perform, read and draw a PCA.
- Understand how to perform and read a ROC curve. Choosing a cut point between poor observations and good ones.
Course Schedule
| Date | Time | Topic | Mode of delivery |
| 5/7 | 5 – 7 pm | Intro lecture | Onsite |
| 7/7 | 5 – 7 pm | Basic graphics 1st | Onsite |
| 12/7 | 5 – 7 pm | Basic graphics 2nd | Onsite |
| 14/7 | 5 – 7 pm | Basic graphics 3rd | Onsite |
| 26/7 | 5 – 7 pm | Biostat st | Onsite |
| 28/7 | 5 – 7 pm | Biostat 2nd | Onsite |
| 2/8 | 5 – 7 pm | Biostat 3th | Onsite |
| 4/8 | 5 – 7 pm | Biostat 4th | Onsite |
| 9/8 | 5 – 7 pm | Biostat 5th | Onsite |
| 11/8 | 5 – 7 pm | Biostat 6th | Onsite |
| 16/8 | 5 – 7 pm | Exam | Onsite |
| 18/8 | 5 – 7 pm | Advanced 1st | Onsite |
| 23/8 | 5 – 7 pm | Advanced 2nd | Onsite |
| 25/8 | 5 – 7 pm | Advanced 3th | Onsite |
| 30/8 | 5 – 7 pm | Advanced 4th | Onsite |
| 1/9 | 5 – 7 pm | Advanced 5th | Onsite |
| 6/9 | 5 – 7 pm | Advanced 6th | Onsite |
| 8/9 | 5 – 7 pm | Corr & Reg. 1st | Onsite |
| 13/9 | 5 – 7 pm | Corr& Reg. 2nd | Onsite |
| 15/9 | 5 – 7 pm | Exam | Onsite |
| 20/9 | 5 – 7 pm | Logistic reg. | Onsite |
| 22/9 | 5 – 7 pm | PCA | Onsite |
| 27/9 | 5 – 7 pm | ROC | Onsite |
| 29/9 | 5 – 7 pm | Data manipulation 1st | Onsite |
| 4/10 | 5 – 7 pm | Data manipulation 2nd | Onsite |
| 6/10 | 5 – 7 pm | Course summary and Ending ceremony | Onsite |
Course Director
Prof. Sameh Magdeldin; DVM., PhD. Head of proteomics research program unit; Basic research department.
Instructors
Tutor:
Sameh Magdeldin DVM., PhD. Head of proteomics research program unit; Basic research department.
Co-tutors:
Eman Abdelnabi; Senior Researcher, M.V.Sc, PhD.
Aya Osama; BSc.
Mohamed Seoudi; BSc.
Recorded Webinar Link for R course for researchers